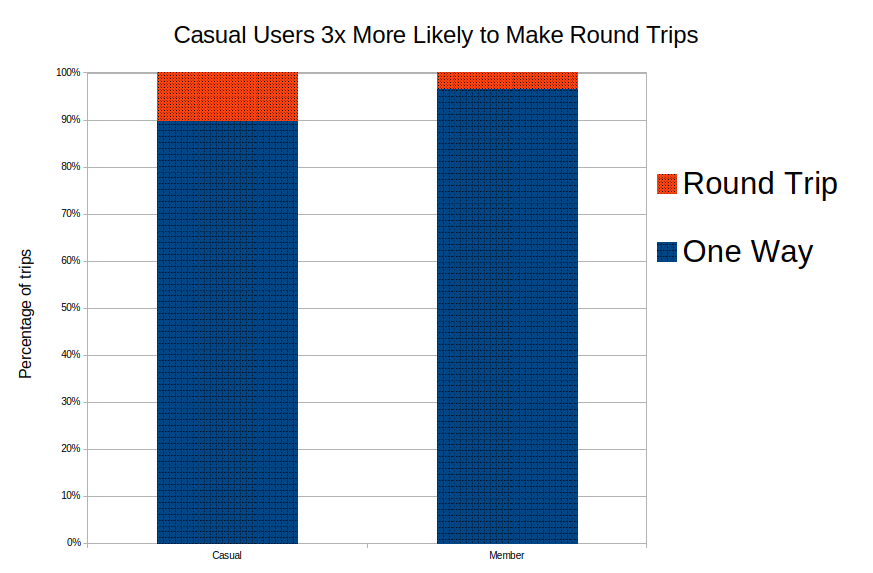
← Back to Portfolio

Chicago Bike Share Analysis

End-to-end business intelligence project analyzing 763k+ trips to identify member vs casual user behavior patterns

Business Challenge

Chicago's bike share system needed insights into user behavior differences to optimize operations, improve marketing targeting, and enhance strategic planning. Through comprehensive analysis of over 763,000 trips from July 2025, I identified distinct usage patterns that inform data-driven business decisions.

Key Insights

3x

Round Trip Behavior

Casual users are 3x more likely to take round trips (10.2% vs 3.3%), indicating recreational focus vs transportation-oriented member usage.
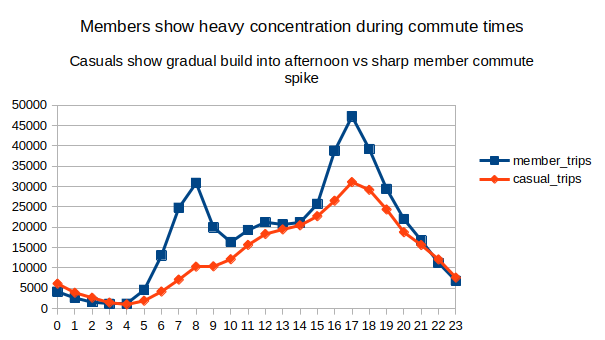
Round trip behavior comparison chart
4-6pm

Asymmetric Commute Patterns

Members show strong afternoon rush peaks but weak morning usage, suggesting multimodal transportation strategies.
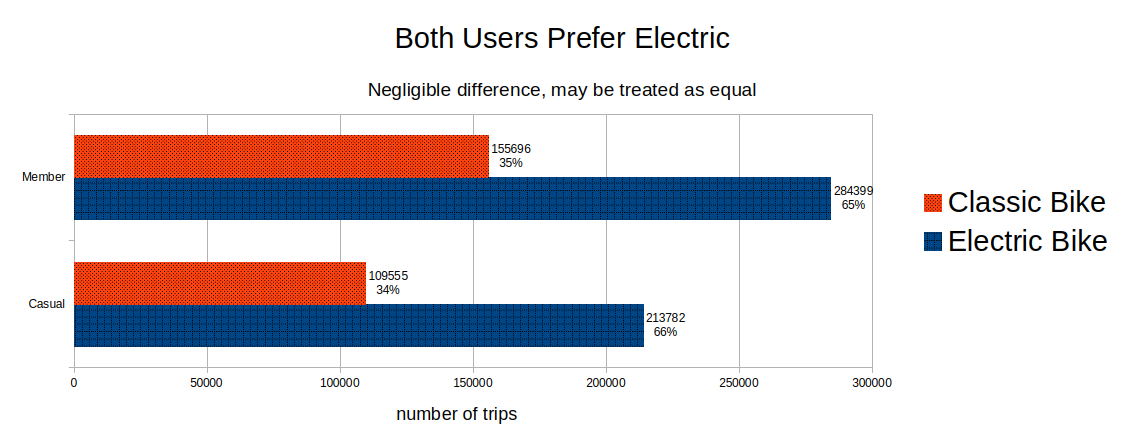
Peak usage times analysis chart
65%

Electric Bike Preference

Both groups prefer electric bikes equally (66% vs 64%), ruling out bike type as a segmentation strategy.

Bike type preference comparison chart

Technical Approach

SQL & SQLite Statistical Analysis Geospatial Calculations Data Visualization Business Intelligence

Explore the Full Analysis

Dive deeper into the methodology, code, and business recommendations